
Updated: June 9, 2023.
Here I am showing 10 simple and useful things that SEOs can learn about their sites from Google Analytics 4.
Before I do that, I need to make a small disclaimer. I am a technical SEO and I admit that Google Analytics is not my main area of expertise, so I probably don’t have as deep of an understanding of GA as many of you do. Neither do I perform some super-advanced nerdy tracking there.
However, I’ve been using Google Analytics (and now also Google Analytics 4) long enough to be able to use it to find the information that I need as an SEO when auditing and analyzing sites.
I believe that – especially in the case of less advanced SEOs and site owners – Google Analytics 4 makes basic SEO analyses way easier because it automatically surfaces the data important from the SEO standpoint. And since GA4 is the default version of GA for new sites, many new site owners or beginner SEOs may find this post very useful.

10 Things You Can Learn About Your Site From Google Analytics 4
Below are the 10 quite simple and important things you can learn about your site by just analyzing the default Google Analytics 4 reports.
If you want to learn more, make sure to check Google’s documentation on Google Analytics 4. There is even a small beginner course on GA4 from Google.
1. Analyze user trends over the last 7, 28, and 90 days
The first thing you see after logging in to Google Analytics 4 is the Home section that shows, among other things, the overview of all users and users in the last 30 minutes.
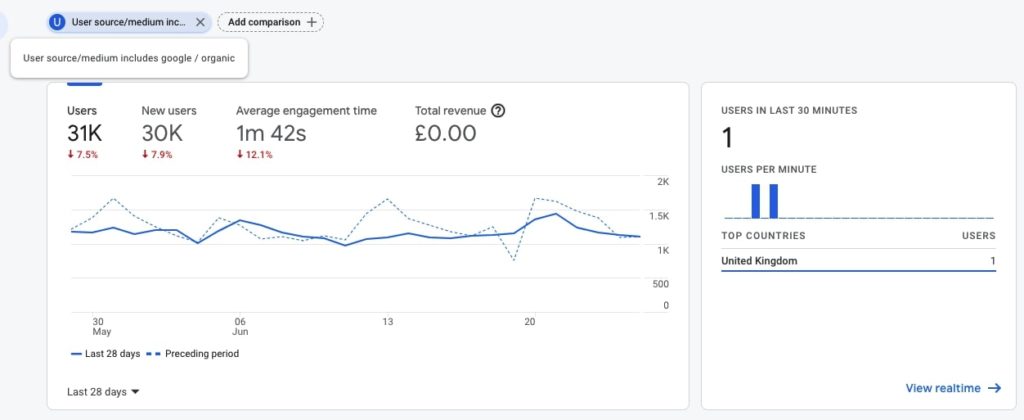
By default, you see the number of users in the last 7 days (a solid line) overlaid with the number of users from the preceding period of 7 days (a dotted line).
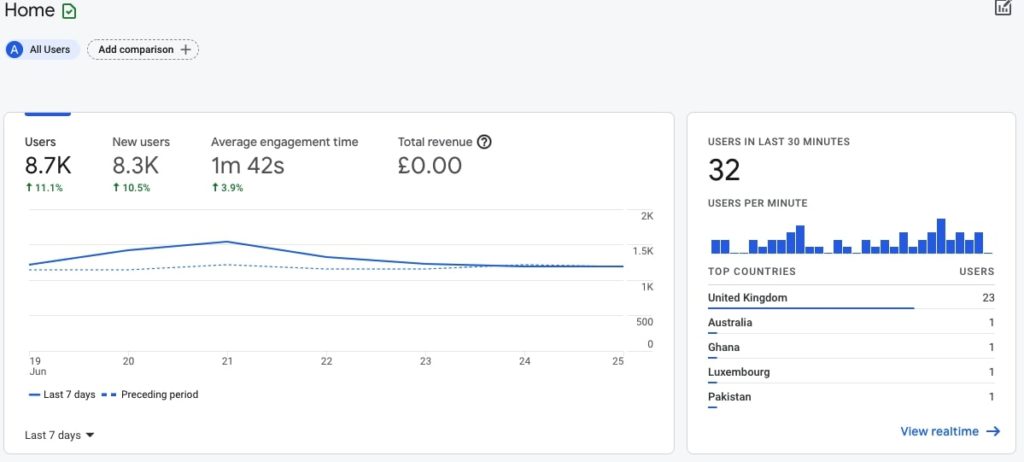
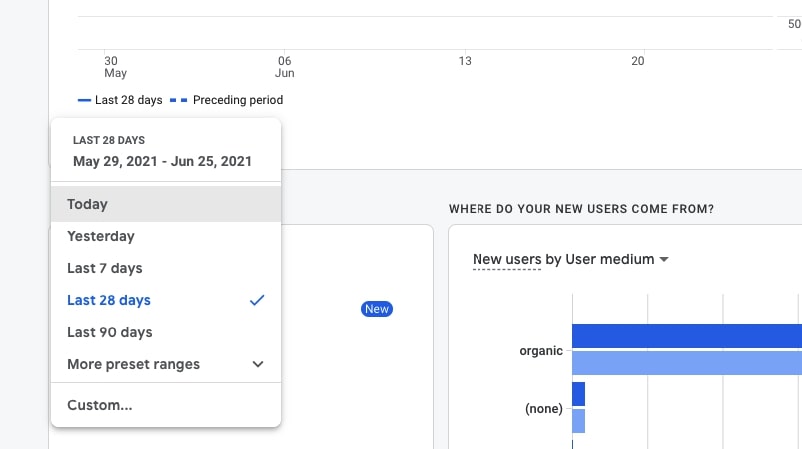
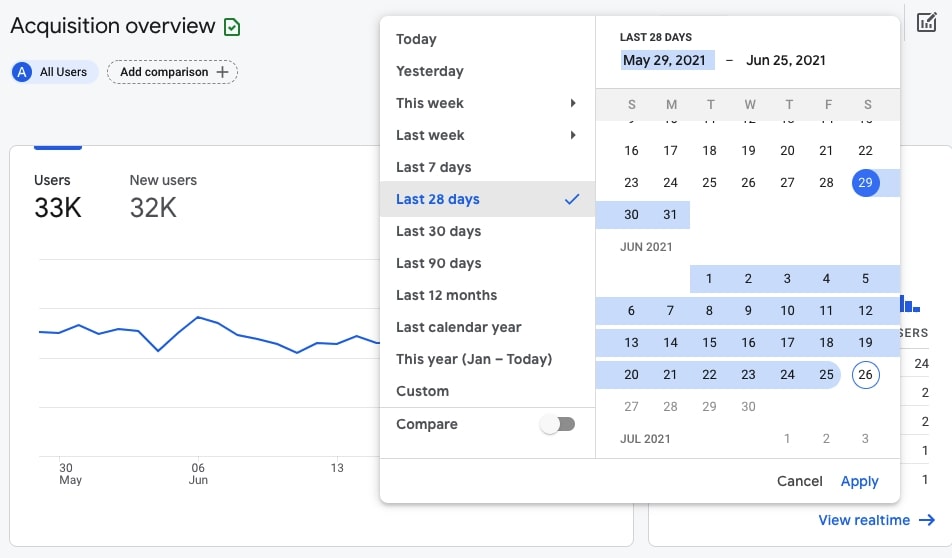
In the left corner of the chart, you can change the date range to display today, yesterday, last 7 days, last 28 days, last 90 days, or a custom range.
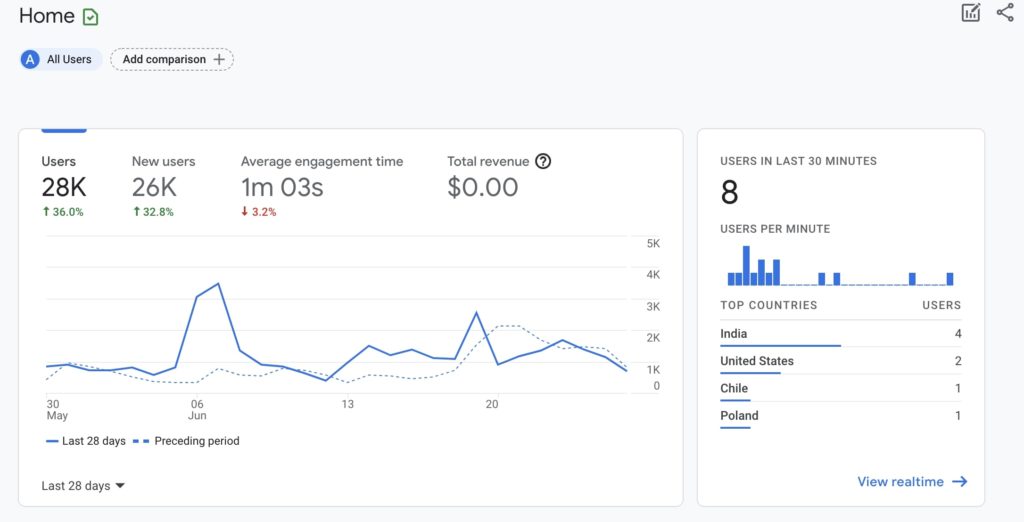
Click on Last 28 days and Last 90 days to compare the last 28 days and 90 days with the preceding period. This can instantly give you an idea of whether things are stable or going in the good/bad direction.
Ideally, you want the solid line to be always above or at the level of the dotted line.
If the dotted line (preceding period) is above the solid line (current period), then you probably want to find the reasons why.
The Home section of GA 4 also lets you compare the data for all users against a specific dimension. All you need to do is click on Add comparison and select the dimension. You can either include or exclude a specific dimension.
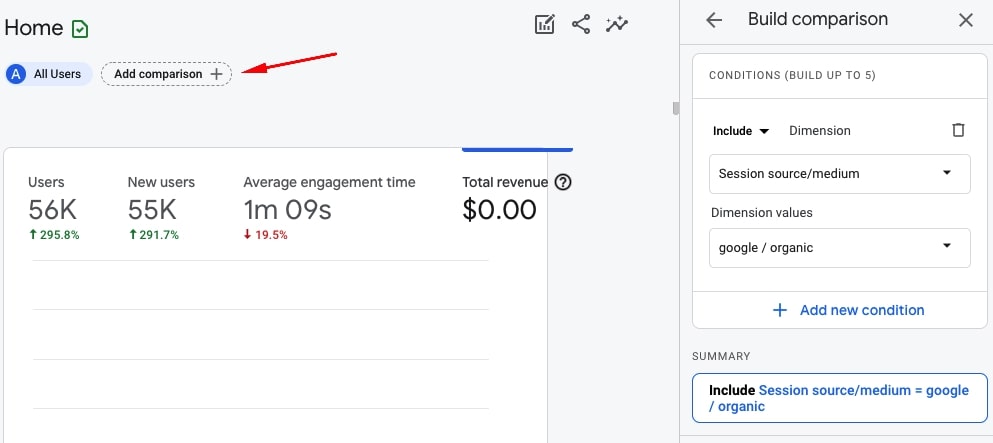
Some of the dimensions you may be interested in:
- Device category = mobile to compare mobile users with all users in different categories, such as users in the last 30 minutes, users by medium, users by country, and more.
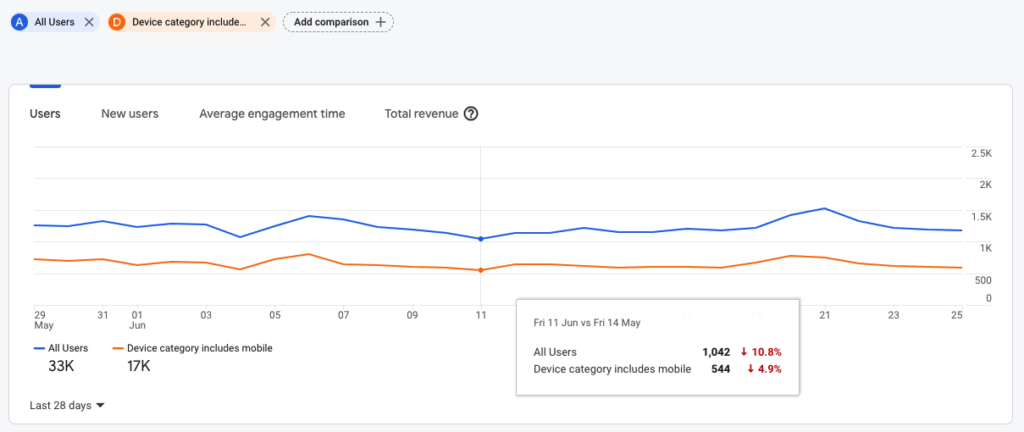
- Country = United Kingdom to compare users from a specific country with all users.
- User source/medium = google/organic to compare all users with organic users from Google.
You can compare up to 5 dimensions at one time, which means that – for example – you can compare all users to mobile users from the UK that come from Google.
You can also filter the view to show you only one specific dimension instead of showing all users or comparing all users with a specific dimension.
2. Analyze real-time users
To see some interesting data about your real-time users, navigate to Realtime which is right below Home in the left sidebar.
By default, you will see the number of users in the last 30 minutes and the information about their device type (desktop, mobile, tablet).
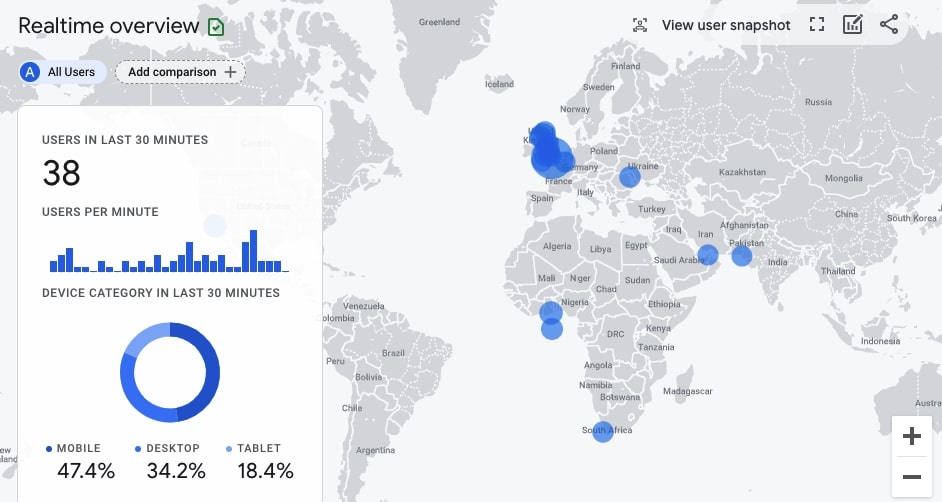
You will see the locations of these users, which is super useful. If you click on any location (on the blue dot), then you will see the comparison of all traffic with the traffic from this one specific location.
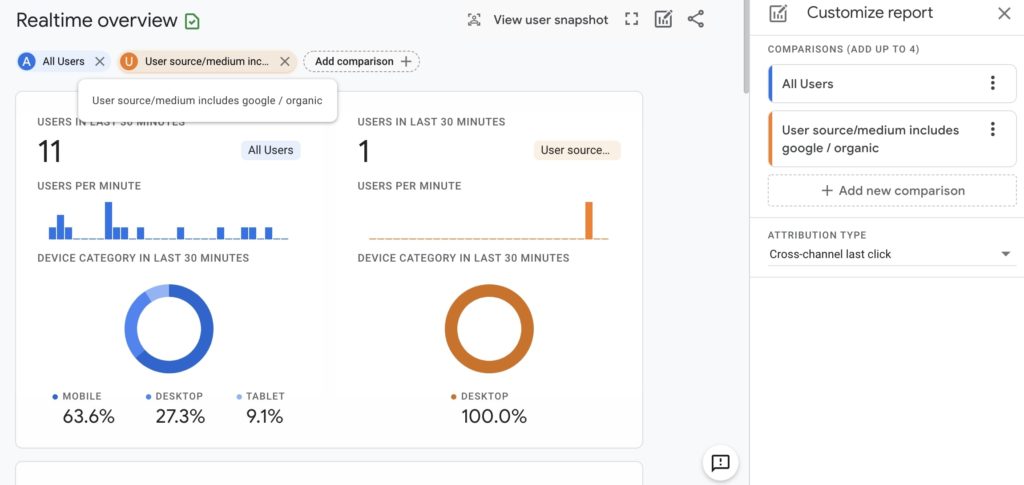
Here in the Realtime view, you can also add comparisons with specific dimensions like I showed you in the above point. Similarly, you can add the comparison to see the data for all users vs only users coming from Google organic search.
If the site is getting a meaningful amount of traffic (1000 or more daily) and there is no activity in the real-time overview, you may want to double-check that everything is OK.
3. Check the number of organic visitors over the last 7, 28, and 90 days
SEO is, after all, about organic traffic, so let’s dive deep into the organic side of things in Google Analytics 4.
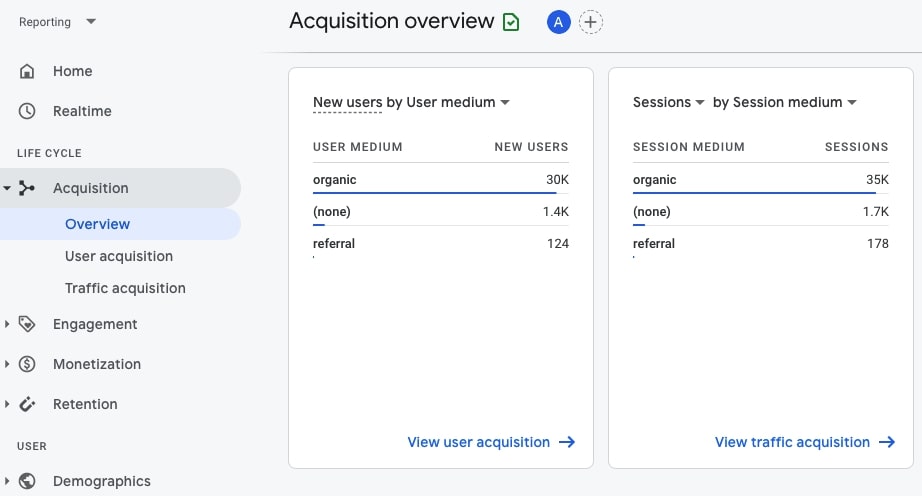
Go to Acquisition > Overview to see the overview of users and sessions. What you are interested in is:
- New users by User medium = organic to see the number of new organic visitors (both from Google and other search engines).
- Sessions by Session medium: organic to see the number of sessions of organic visitors.
These dimensions are already defined in the default view of the Acquisition Overview.
Change the date range in the right top corner to see the data from the last 7, 28, and 90 days. It’s always a good idea to analyze the data using different (longer and shorter) data ranges.
Next, go to Acquisition > User acquisition to take a deeper look at organic traffic.
- Analyze the charts showing New users by User medium and New users by User medium over time.
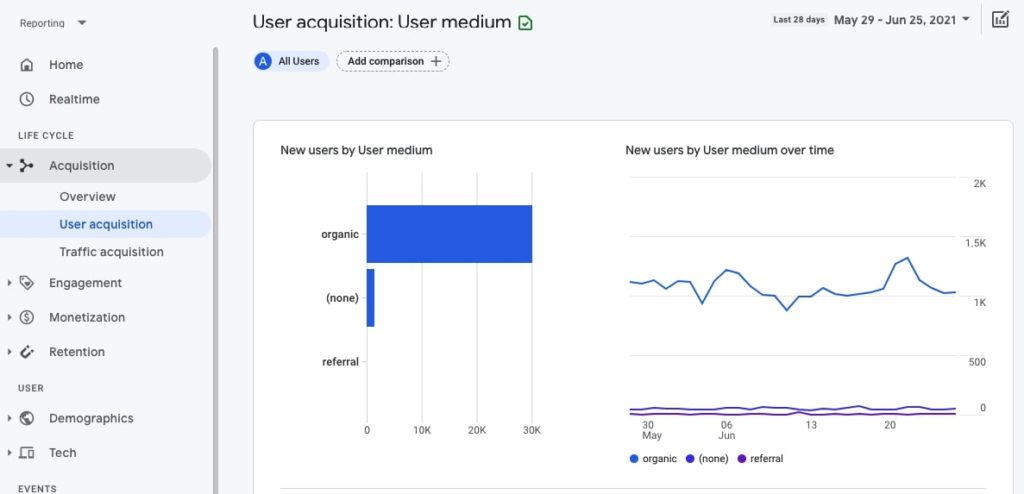
- Set different data ranges to see trends more clearly.
- Analyze the data you see in the table below the charts, especially the number of Engaged sessions and Average engagement time.
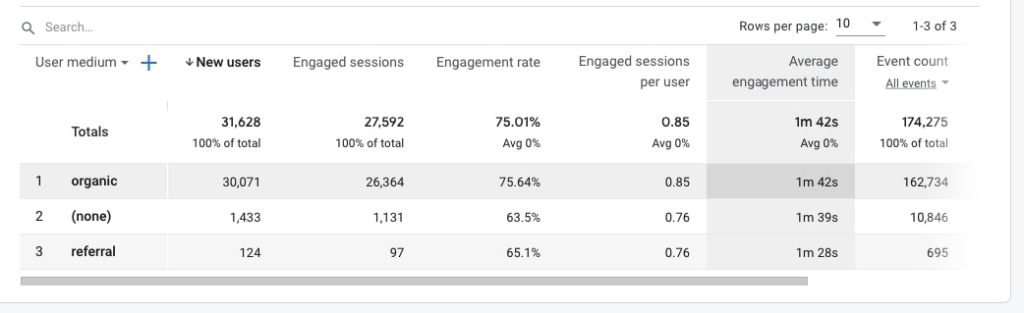
Are these numbers lower or higher for organic search?
Are users from one specific medium way more engaged than others?
4. Analyze traffic acquisition paying special attention to traffic from search engines
Now we are diving even deeper into organic traffic.
Go to Acquisition > Traffic acquisition. Here you can see the data about the traffic sources of the site. In most cases, you want google/organic to be dominant but that – of course – depends on the site.
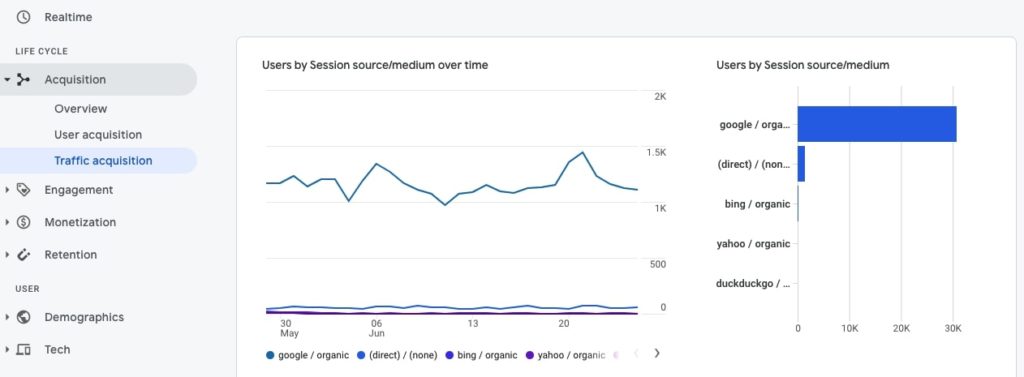
Navigate to the table to analyze specific metrics for these traffic sources.
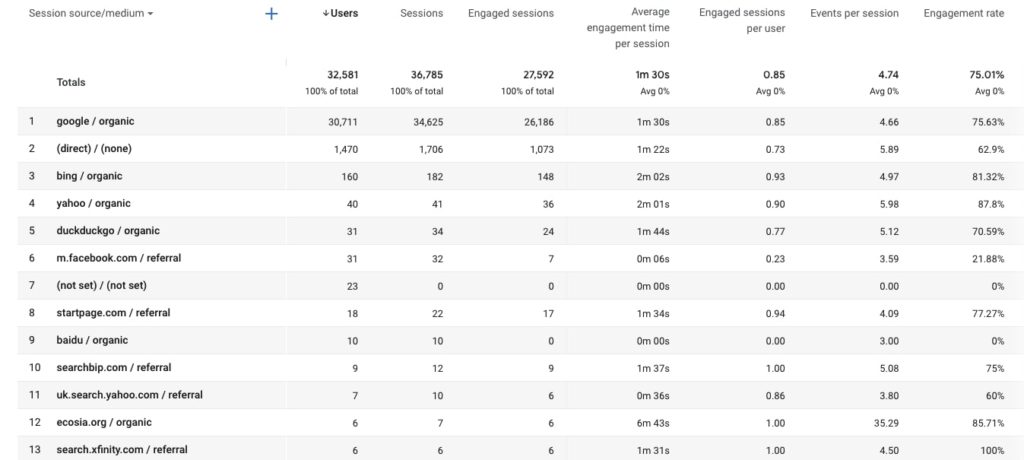
You may want to pay special attention to:
- Metrics, such as Engaged sessions, Average engagement time per session, users, sessions for different traffic sources.
- All types of organic traffic which may include bing / organic, duckduckgo / organic, yahoo / organic, ecosia.org / organic, ask / organic, and other search engines.
Do these other search engines account for a significant amount of organic traffic? - All types of referral traffic which may include, for example, pinterest.com / referral.
Does the site get a significant amount of traffic from a specific site?
Does this traffic behave differently than traffic from search engines?
5. Analyze basic user engagement metrics
Now, let’s learn more about how engaged website visitors actually are.
Go to Engagement > Overview.
By default, you will see the chart showing metrics, such as Average engagement time, Engaged sessions per user, and Average engagement time per session.
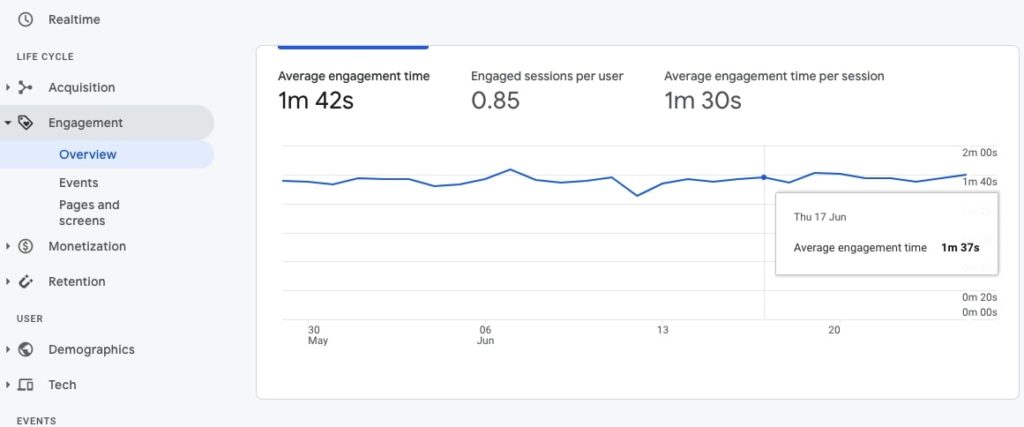
What you – as an SEO – are interested to see is whether engagement metrics changed and how they have changed (positively or negatively).
Here is what you can do:
- Analyze engagement metrics setting different data ranges.
Are there any spikes or lows? - Compare all engagement data with the data for a specific dimension. For example, you can use Device category = mobile to compare average engagement metrics for all users with mobile users only.
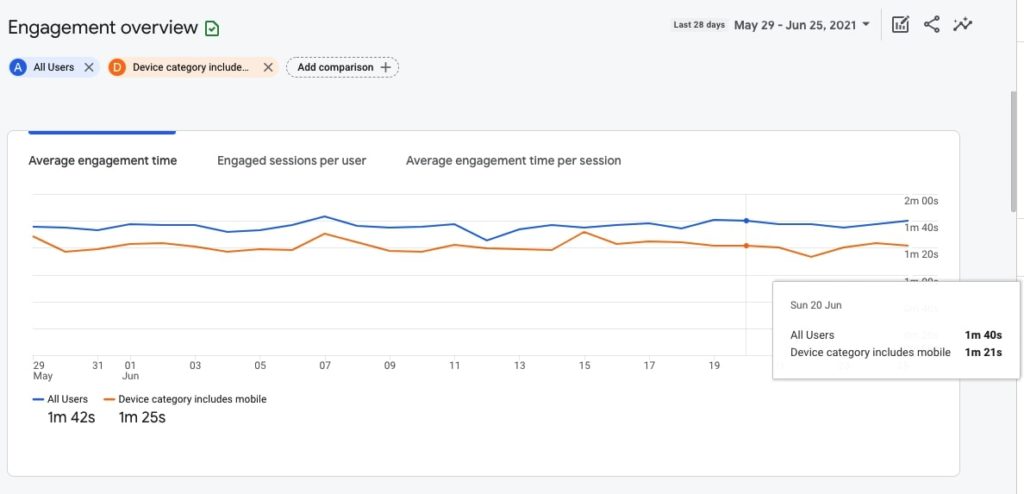
Is the engagement for mobile users a lot lower than for desktop?
6. Analyze user retention (new vs returning users)
The users who return to your website are the most valuable users because they already know and like your website. What’s more, returning visitors are usually way more engaged and may be interested in buying your products or services.
To check the number of returning visitors, go to Retention > Overview.
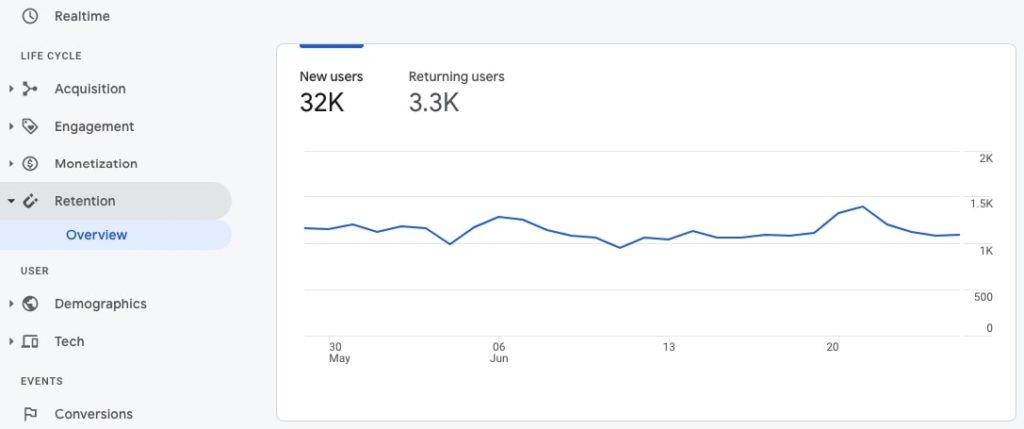
Here is what you can do:
- Compare the number of New users and Returning users.
Is there a significant number of returning visitors? - Use different data ranges, such as the last 7, 28, and 90 days.
A website having few or no returning visitors may have some quality issues. However, that is not always true and it heavily depends on the website type, topic, or purpose. Affiliate sites, for example, usually have few returning visitors and that’s OK. But in the case of my website, having no returning visitors would probably mean that my site has quality issues and is not attractive enough for its visitors.
7. Analyze top countries and how engaged the users from these countries are
The chances are that the site targets users from a specific country or a few specific countries. In the case of SEOSLY, my target country is the US, so I am especially interested in how engaged the US traffic is.
Go to Demographics > Overview and you will see the demographics overview of users by Country and City.
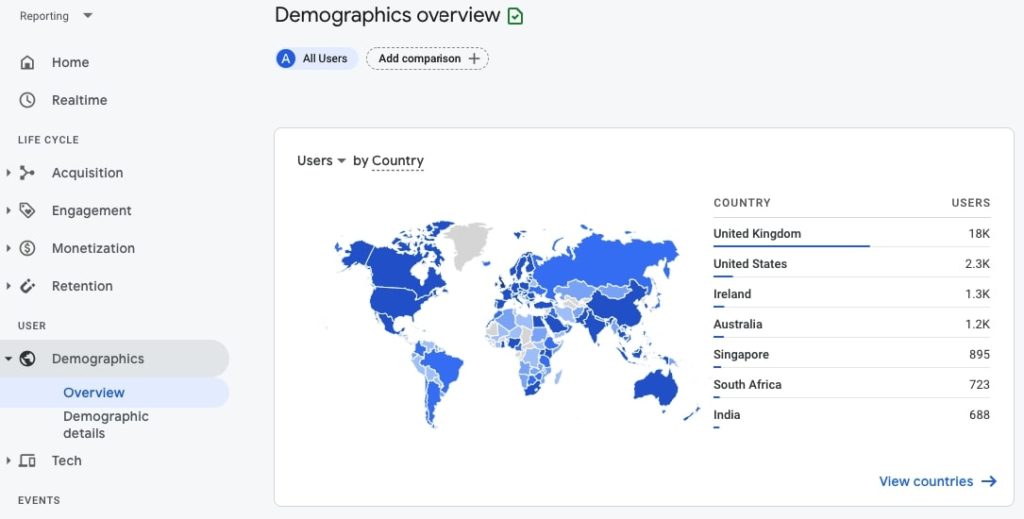
- Identify the top 2-3 countries that bring the majority of users.
- Analyze the data using different date ranges.
Does the majority of traffic actually come from the target country? If not, is this something you would like to change?
8. Learn about the devices the users of the site use
Learning about the tech side of your users is probably the most interesting part!
Thanks to knowing what types of devices, operating systems, or browsers your users use, you can better meet their needs by implementing specific optimizations on your site or double-checking that your site displays well on a specific browser.
Go to Tech > Overview to see the technical overview of your visitors.
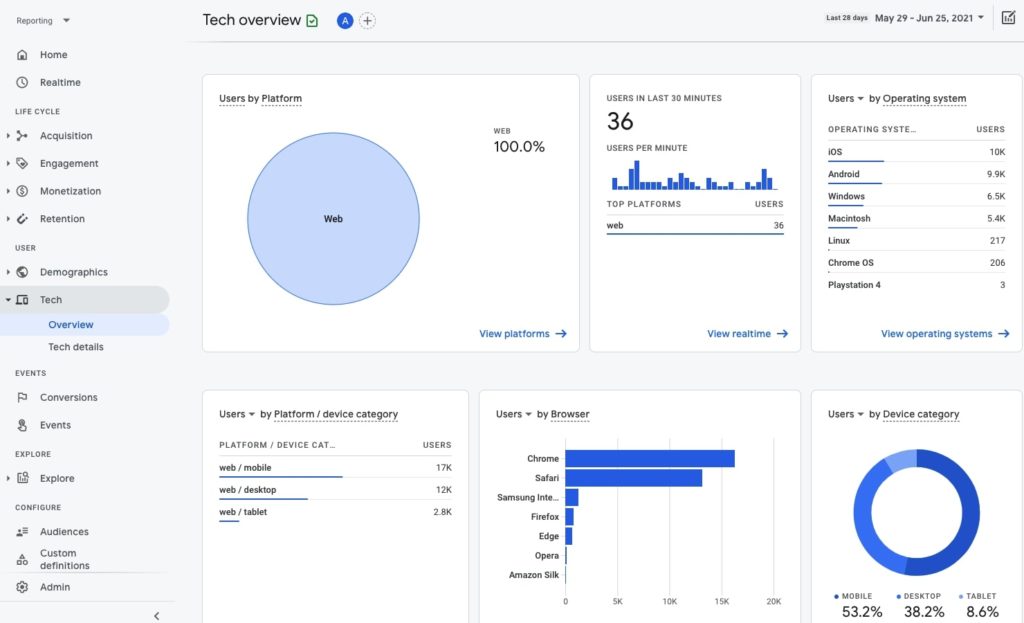
Here is what you can do:
- Analyze the table showing Users by Operating system. Click View operating systems to learn more details and analyze how engaged users of specific operating systems are.
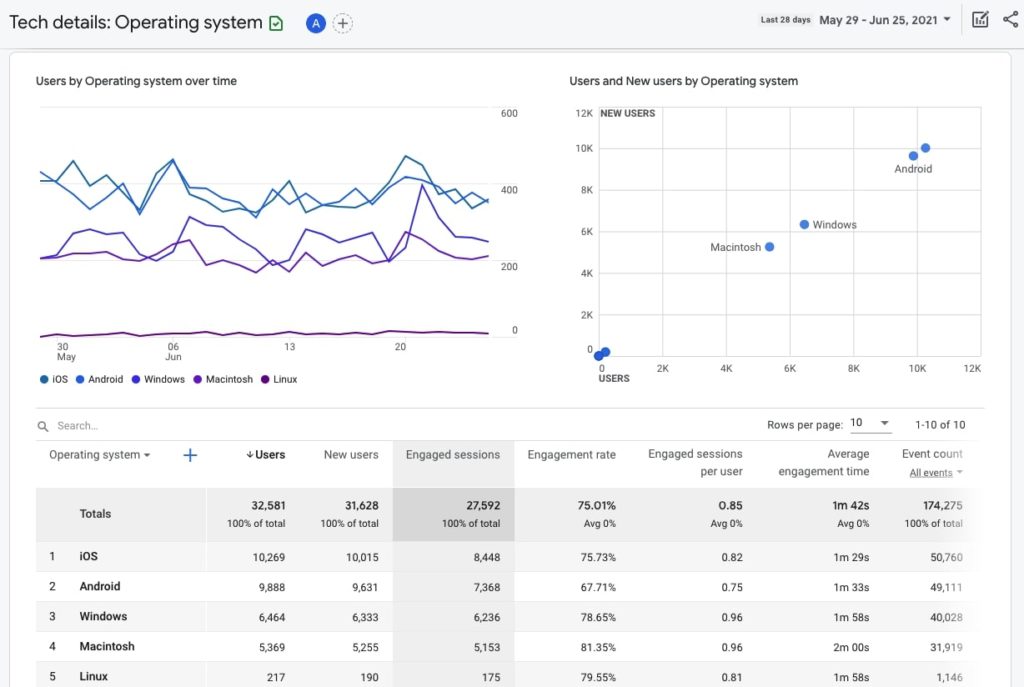
What operating system is dominant?
What is the average engagement time of users of specific operating systems? Is it especially low or high for one specific operating system?
- Analyze the table showing Users by Platform / device category to learn what device category is dominant (mobile or desktop). Click View platform devices to see more details and analyze engagement metrics of different device category users.
Are desktop or mobile users more engaged? Are there huge differences between the two? - Analyze the table showing Users by Browser. Click View browsers to learn more details.
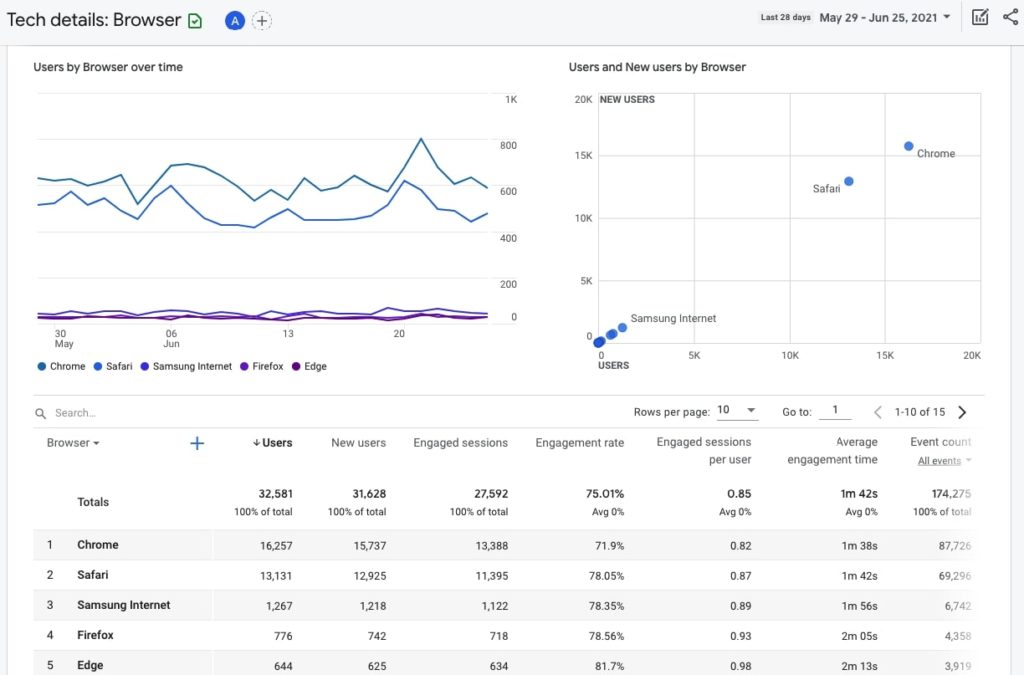
What is the dominant browser? Is it Chrome?
Does the site display correctly on the dominant browser?
Is the engagement rate especially low on one specific browser type?
9. Check how engaged your users are
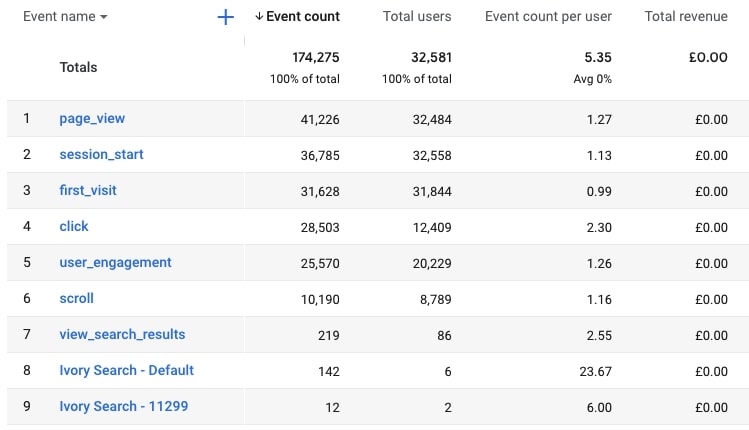
Google Analytics 4 by default allows you to track eight different types of events, such as page_view, session_start, user_engagement, first_visit, scroll, click, view_search_results, and file_download.
Go to Engagement > Events to see the overview of these events.
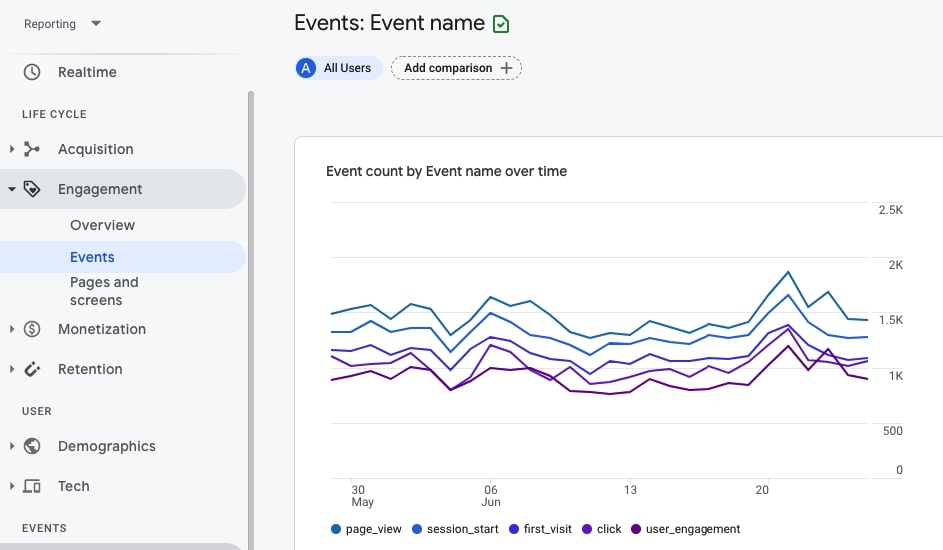
Here are the events you may be interested in:
- scroll which shows you the number of visitors who scrolled at least 90% of the page. These are highly engaged users.
How many users managed to scroll down the page? - first_visit shows you the number of new visitors.
Go to Engagement > Pages and screens to learn about the best performing pieces of content.
You will see the table showing the web pages that have the biggest number of views.
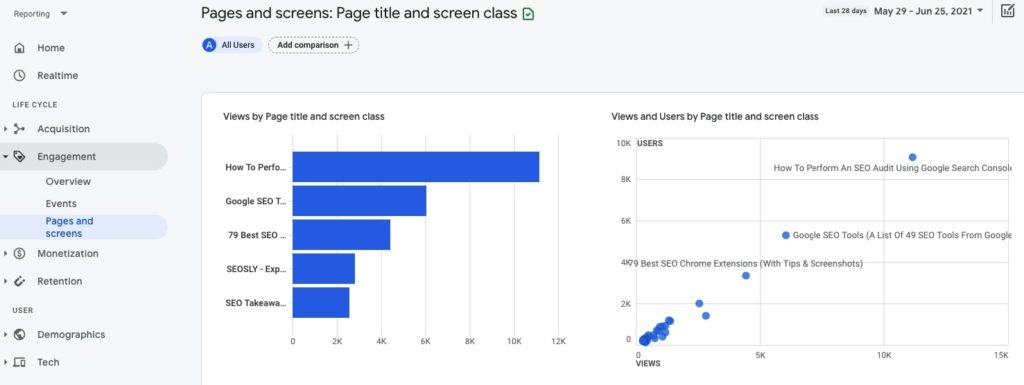
Here is what you may want to check:
- The average engagement time for the most often visited web pages.
Is the average engagement especially high or low for one specific web page? - The number of unique user scrolls a given page received.
Is there a page that has a large number of visitors and practically no unique user scrolls?
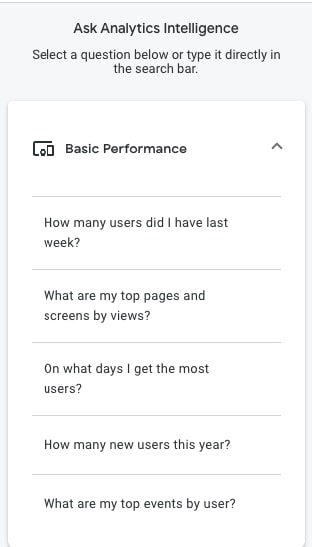
10. Take a deep look into automated Analytics Intelligence Insights
Automated Analytics Intelligence Insights is one of my favorite sections of Google Analytics 4. It contains a lot of super useful suggested questions relating to basic performance, demographics, user acquisition, traffic analysis, technology, and e-commerce.
Knowing the answers to these questions can really help you better understand the site and make good decisions regarding its future SEO strategy.
Click on the Insights icon in the top right corner to open automatic Analytics Intelligence Insights.

Here are the selected categories and questions together with my own tips on what you may do with these insights.
Click on any category to see the suggested questions. You can either click on the suggested question or type it directly in the search bar. I strongly recommend you go through every question from the list.
Basic Performance
- How many users did I have last week?
- What are my top pages and screens by views?
- On what days do I get the most users?
- How many new users this year?
With these insights, you can get a basic understanding of the site’s current performance.
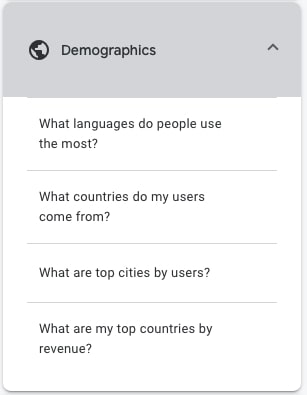
Demographics
- What languages do people use the most?
- What countries do my users come from?
Knowledge about the language and location of your users is essential to make sure your content suits their needs. This is a quick way to learn these two basic things about the site.
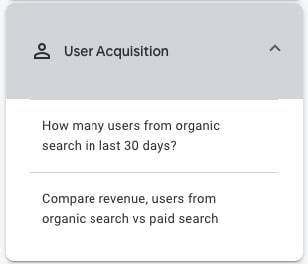
User Acquisition
- How many users from organic search in the last 30 days?
Knowing how many people found the site through search engines over the last month is also crucial for SEO.
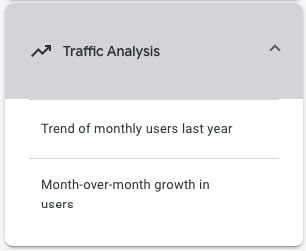
Traffic Analysis
- Month-over-month grows in users
With this insight, you can learn whether the site’s traffic is stable, increasing, or decreasing.
Technology
- What devices are used the most?
- What browsers are used the most?
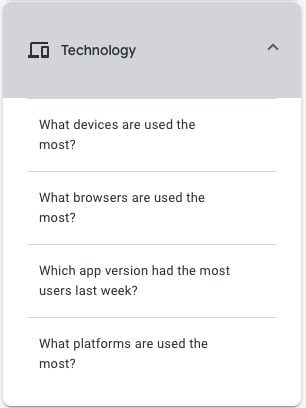
In most industries, the majority of site visitors use mobile devices. However, there are exceptions. You definitely want to know if the site is that exception.
Google Analytics 4 & SEO: Final Thoughts
Congratulations on getting to the end of my basic Google Analytics 4 guide. I really hope that you have learned some interesting things about your site and got some useful SEO insights.
I know that Google Analytics 4 has received a lot of negative comments recently especially from more advanced digital marketers. However, I believe that GA 4 is a super useful tool because you don’t need to create any custom reports or events to learn about the state of the SEO of the site.
And that’s what I think makes Google Analytics 4 more accessible to less advanced SEOs and website owners who want to make use of analytics data. It’s also great for site auditors who often don’t need more information than what’s provided in GA 4 by default.
Other articles you will also be interested in:
Thank you for this! I’m an SEO content writer and digital strategist, and I’ve been super confident with Google Analytics reporting for years. But every time I opened GA4 my eyes just kind of glazed over. This was so much easier for my brain to digest, versus all the overly technical articles that immediately dive into custom reports.
Hi Pam 🙂 Yes, GA4 is a bit hard to get used to but finally, I think it is the best idea to use it together with standard GA. Anyway, I am very happy my guide helped you. Cheers 🙂
Are there any of these features unique to GA4? It seems to me all of these could be accomplished with the older universal version of Google Analytics (without GA4’s extra layers of complicated metrics and baffling user interface). I am still seeking a completing reason to upgrade.
To me, the main difference between GA4 and standard GA is that GA4 lets you see more insights without digging deep as it is often necessary with standard GA. I think the best way is to use both simultaneously.