Want to start off this month with a couple big Thank You’s to Niche Website Builders and Spencer Haws for inviting me to their podcasts. If you missed it, do check out them out:
Feb. 2, 2021 – Niche Website Builders Podcast
March 3, 2021 – Spencer Haws and the Niche Pursuits Podcast
Now, onto the February numbers.
I wish I could say the amazing growth had continued, but instead, the downtrend from seasonality is playing out.
February Total Revenue of $4,559.47
30.7% Decline from January
Total revenue declined over 30% from January, but I’m not that disappointed. I’m pretty happy with the results, considering 9 months ago in June 2020, total earnings were only $23.46 across the 3 sites.
19,335% Increase in Total Revenue – $23.47 to $4,559.47
There were a couple amazing months in November and December thanks to Black Friday and Holiday traffic and sales. I may need to wait until November 2021 to see a repeat of those numbers, but I’m going to continue working on them until then to see what I can do to increase traffic and earnings.
As I continue to do these monthly income reports on my affiliate marketing journey, I realized that it’d be helpful to see more historical data of how things started. It’s good to see the past month’s revenues and expenses, but it’s also good to see even further back for more analysis. History helps to tell the story.
With each individual site’s P&L breakdowns, I’ll show from when I first started or acquired the sites. As the tables grow, I’ll need to readjust and make a separate page for the history, but I’ll do that when I feel the reports are getting too long.
The historical data will also help me show you how I analyze the numbers. My income reports can get lengthy sometimes, because I don’t want to just show numbers. That doesn’t help you.
The analysis and how to look at the numbers will help more. So I’ll try to show more of how I analyze to try and increase earnings.
Table of Contents
Monthly Profit & Loss Overview – Feb. 2021
Here are the general numbers for the 3 main case study sites. Brand new Site 4 isn’t generating anything yet, but I’ve included it down below for record keeping.
| Site 1 | Site 2 | Site 3 | TOTAL | |
|---|---|---|---|---|
| Sessions | 27,279 | 9,658 | 512 | 37,449 |
| Pageviews | 27,534 | 10,520 | 581 | 38,635 |
| Amazon Associates Earnings | $1,392.76 | $1,608.47 | $10.60 | $3,011.83 |
| Ezoic Earnings | $1,315.86 | $217.38 | $14.40 | $1,547.64 |
| Other Earnings | N/A | N/A | $0.00 | $0.00 |
| Total Revenue | $2,708.62 | $1,825.85 | $25.00 | $4,559.47 |
| Expenses | $242.63 | $130.23 | $7.55 | $380.41 |
| Profit / Loss | $2,465.99 | $1,695.62 | $17.45 | $4,179.06 |
| ARPU | $0.099 | $0.189 | $0.049 | $0.112 (Avg) |
Site 2’s Amazon earnings outpaced Site 1’s again with only 35.4% of Site 1’s traffic. I’ll talk more about ARPU and earnings per visitor below.
Site 3 had a big drop in Amazon earnings too this month. The last 3 months were between $64.92 and $75.72 in Amazon earnings. I’ll dig into that below.
New Site 4 was just about catching up and getting articles up that’ve been sitting there from the writers. I still haven’t published them all, but I’m close.
Even though the surface level numbers have declined, I’m still encouraged by what I’m seeing. I’ll attempt to dive deeper and to see what the data tells me for each affiliate website.
Site 1 – Recap And Income Report Breakdown
| SITE 1 | SESSIONS | REVENUE | EXPENSES | P&L | ARPU |
|---|---|---|---|---|---|
| June 2020 | 1,078 | $8.49 | $2,187.25 | ($2,178.76) | $0.008 |
| July 2020 | 1,086 | $57.08 | $807.99 | ($750.91) | $0.053 |
| August 2020 | 1,559 | $169.67 | $276.55 | ($106.88) | $0.109 |
| September 2020 | 2,984 | $132.68 | $943.40 | ($810.72) | $0.044 |
| October 2020 | 12,431 | $1,204.38 | $970.60 | $233.78 | $0.097 |
| November 2020 | 65,622 | $8,600.72 | $1,451.26 | $7,149.46 | $0.131 |
| December 2020 | 51,080 | $6,801.72 | $902.50 | $5,899.22 | $0.133 |
| January 2021 | 32,750 | $3,857.05 | $1,265.87 | $2,591.18 | $0.118 |
| February 2021 | 27,279 | $2,708.62 | $242.63 | $2,465.99 | $0.099 |
Total earnings of $2,708,62 are made up of affiliate and display ads:
- $1,392.76 – Amazon Affiliate Earnings (US & International)
- $1,315.86 – Ezoic Earnings
Expenses were the lowest it’s been in months, because the Shotgun Skyscraper Link Building campaign with Niche Website Builders stopped at the end of January. I’m close to finishing the review of the campaign, so will post that soon too.
Even though the numbers seem like they’ve dramatically declined and the site isn’t doing well, I’m not too discouraged.
Site 1 has about a 70/30 ratio of commercial to informational articles. Now that peak buying season is over, I’d expect it to be down. I’ve ordered many informational articles recently to help combat that.
ARPU has also declined to $0.099 ($99.00 earnings per 1,000 visitors), but it’s not surprising as visitors weren’t buying as many of the big ticket items.
On the surprising side, the click-through-rate (CTR) to Amazon was the highest it’s been since traffic started kicking up in Oct. 2020. CTR to Amazon was 23.68%.
Site 1 Google Analytics Traffic
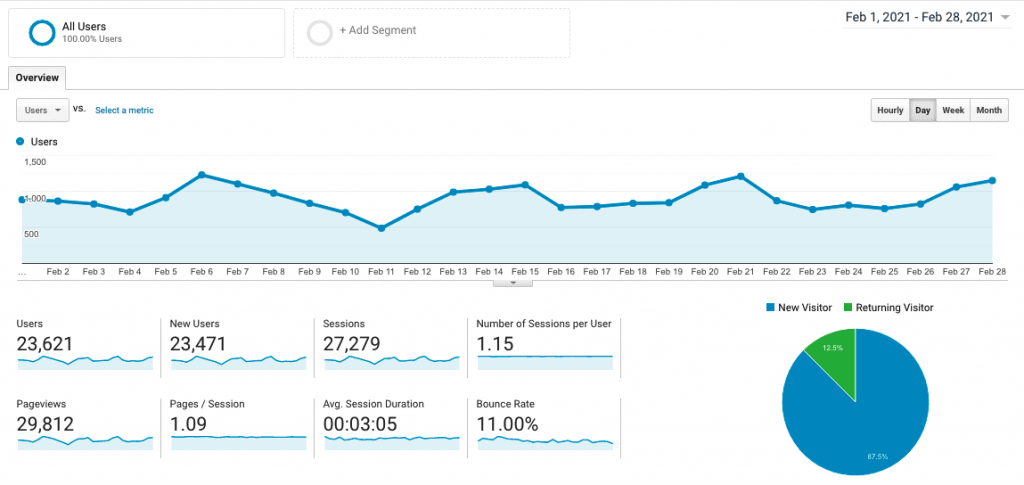
The spikes in traffic were the weekend when people had more time to search for products. That’ll always be the case as people have more time on weekends to research product information.
With the month-to-month traffic decline, the first thing I did was to look at Google Search Console to see if I was hit by any Google Updates or ranking drops.
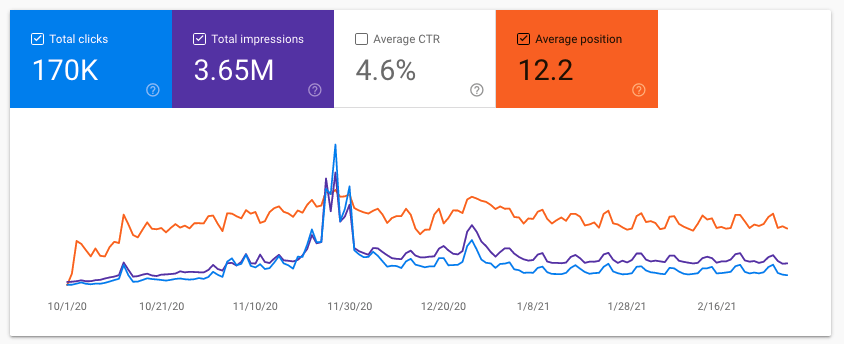
Besides Black Friday and Christmas times, everything’s been relatively steady. Rankings have minor fluctuations on the weekends, because more people are searching for the high ranking articles.
As those high rank keywords show up more, that brings the Average Position up. On the flip side, if you have lower ranking articles that get a lot of search impressions, those will bring down the average.
I did look at top articles and keywords, but also nothing that suggested a Google core update hit.
On to Average Session Duration and Bounce Rate for the last 5 months:
- October – 3:10 and 10.88%
- November – 3:34 and 9.49%
- December – 3:23 and 10.95%
- January – 3:01 and 12.08%
- February – 3:05 and 11.00%
Here’s my analysis of the numbers.
Nov. and Dec. had the highest session times and lowest bounce rates, which make sense because people were all about buying. They wanted to make sure they got the information to help them make purchases.
January was a clear lull after people spent a good amount of money in the previous 2 months, so they were doing more passive research. They weren’t in active buying mode.
Feb. increased ever so slightly as people got paid again and there’s some distance from the holidays.
My conclusion is people were staying and reading articles for a longer time to get the information they needed (higher session duration times). Once they got what they needed, they clicked through to Amazon (lower bounce rates). On Amazon, they’d read more about the products and possibly purchase.
During January, people would read more and not necessarily be as driven to purchase as they were during the holiday “buy now” phase.
Site 1 Amazon Affiliate Earnings
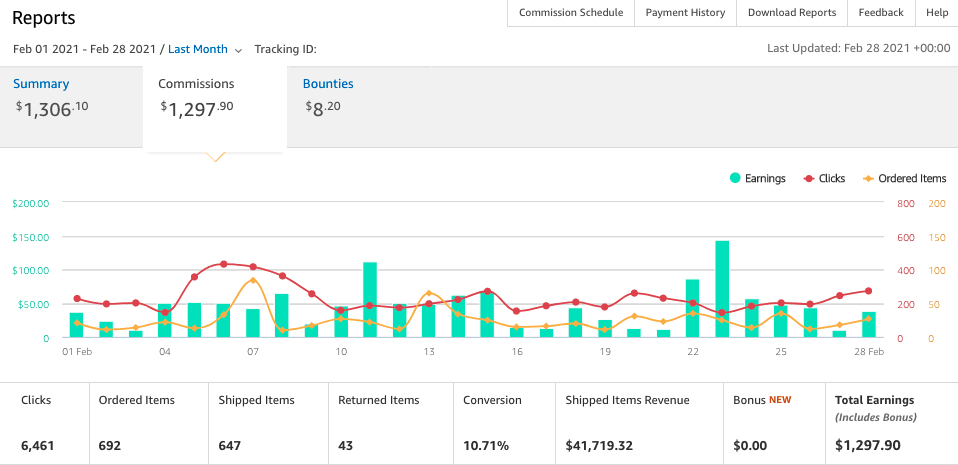
$1306.10 in US Amazon Affiliate earnings and $86.66 from International Amazon aren’t too bad.
When I do my Amazon analysis, these are some metrics I like to keep track of to help tell more of the story. These numbers help to explain how my content is doing, but also consumer purchasing trends in the niche.
I could dig in further by downloading the full Amazon reports, but these numbers give me enough to work off of.
| OCT | NOV | DEC | JAN | FEB | |
| Sessions | 12,431 | 65,622 | 51,080 | 32,750 | 27,279 |
| CTR to Amazon | 20.81% | 20.34% | 18.98% | 20.44% | 23.68% |
| Order Conversion % | 11.40% | 15.06% | 14.09% | 12.21% | 10.71% |
| Shipped Rev per Click | $10.72 | $12.09 | $12.74 | $8.60 | $6.46 |
| Return % | 2.56% | 3.44% | 5.40% | 10.37% | 6.65% |
| Avg. Price per Ship. Item | $101.56 | $102.38 | $78.43 | $67.78 | $64.48 |
Sessions – Visitor sessions
CTR to Amazon – Click-Thru-Rate from Site to Amazon. Gives me an idea of how optimized I am with conversions. Do I need to look at CRO or not.
Order Conversion % – The Conversion Rate for visitors who clicked to Amazon and ordered. Another way of looking at it is: 15% means there was 1.5 orders for every 10 clicks/visitors to Amazon
Shipped Rev per Click – Revenue for each Shipped Item per Amazon Click. How much Amazon makes per click to Amazon. Helps give me a picture of the price levels of products.
Return % – The percentage of returns for Shipped Items. Returns can be from previous month purchases. Helps fill the picture of the previous month’s product sales and informs me if I should dig in more to avoid certain products / categories.
Average Price per Shipped Item – Are people ordering lower or higher priced items than the past.
From those numbers, here are possible takeaways:
- Lower-priced items are working better.
- Newer articles of lower-priced products have started to rank higher
- Shipped Revenues per Click could be lower the last couple months as Returns spiked. Prices of Returned Items are subtracted from the Shipped Revenue. Could be that high-priced items purchased in earlier months were being returned.
There are other things to look at, but those metrics can help tell you whether there are things to possibly work on to improve CRO, products for review, etc.
Site 1 Ezoic Earnings
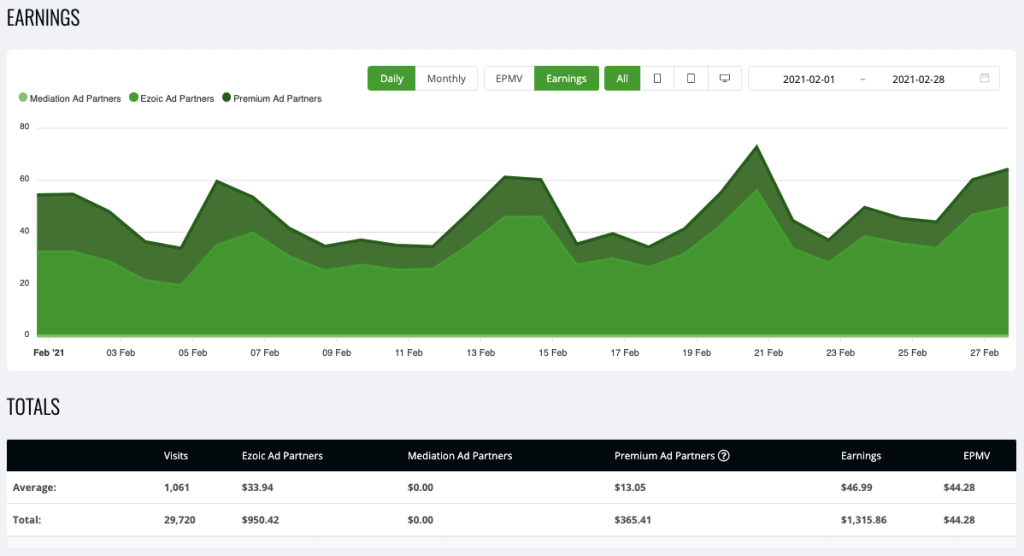
Ezoic revenues with Premium ads earned me $1,315.86 with an EPMV of $44.28.
EPMV is lower than January’s at $56.02. From what I can gather, EPMV has dropped for a couple reasons.
- Lower Premium plans give lower Premium revenue. Still better than the standard ad revenues.
- Had more traffic to informational posts, which lowered the EPMV
Site 1 Expenses
Didn’t spend too much in February. Site 1 costs were $242.63, mostly for content and Ezoic costs.
Site 1 Plan for March
Continue with adding more content. I’ll be focusing more on informational content in March.
I’ll look to build targeted links here and there, but not a shotgun approach for now.
I may also take a look at cleaning up my internal links and structure. I feel like it’s gotten a little messy as the site’s grown, so will try and find time to go through all of the internal links. I’ve been pushing it off a little as I’m anticipating a drop in traffic as Google recrawls and relearns how the site is organized. So I didn’t want to do it yet.
Site 2 – Recap And Income Report Breakdown
Here are Site 2’s visitor traffic, earnings, costs, and profits.
| SITE 2 | SESSIONS | REVENUE | EXPENSES | P&L | ARPU |
|---|---|---|---|---|---|
| June 2020 | 229 | $14.97 | $564.00 | ($549.03) | $0.065 |
| July 2020 | 282 | $12.58 | $22.00 | ($9.42) | $0.045 |
| August 2020 | 571 | $48.61 | $13.56 | $35.05 | $0.085 |
| September 2020 | 936 | $156.00 | $74.00 | $82.00 | $0.167 |
| October 2020 | 2,688 | $709.88 | $155.60 | $554.28 | $0.264 |
| November 2020 | 9,373 | $2,037.53 | $402.41 | $1,635.12 | $0.217 |
| December 2020 | 16,803 | $4,199.67 | $95.50 | $4,104.17 | $0.250 |
| January 2021 | 14,862 | $2,617.94 | $230.06 | $2,387.88 | $0.176 |
| February 2021 | 9,658 | $1,825.85 | $130.23 | $1,695.62 | $0.189 |
Site 2’s ARPU of $0.189 per visitor is the best out of all the case study sites. I just need to focus more here and take advantage of that.
For every 1,000 Visitors, that’s an extra $189 in my pockets. The ARPU has held relatively steady with a nice range from the teens to mid-20’s.
Site 2 Google Analytics Traffic
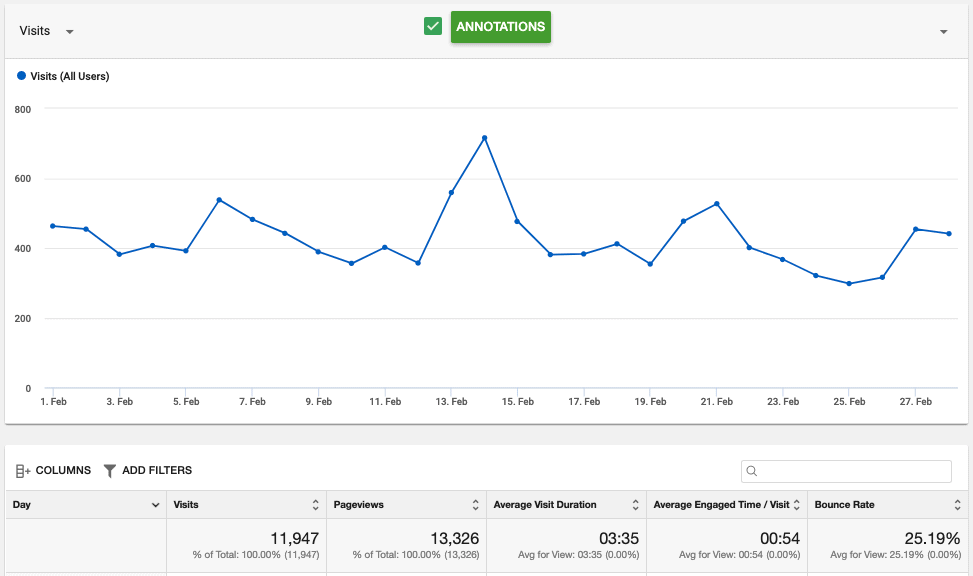
Google Analytics Sessions went back under 10k. That stings a little. Pageviews was 10,520, but I still use Sessions more. Ezoic’s Bid Data Analytics does put Visits at 11,947.
I’m not sure how accurate the Google Analytics numbers are with traffic for February. Things got interesting with Site 2. Let’s take a look at the traffic numbers first.
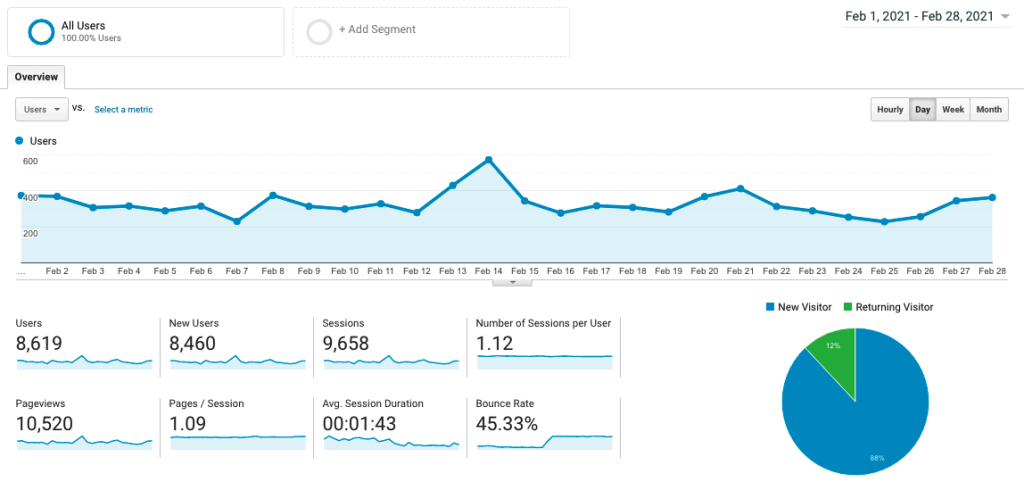
In general, Ezoic’s numbers are higher, but two days stood out. Feb. 6th and 7th show a discrepancy. Ezoic shows a spike on the 6th and the 7th numbers were still above the norm. GA showed a little increase on the 6th, but then a big dip below the norm on the 7th.
Ezoic’s analytics are measured at the DNS level, so there’ll be discrepancies, but the differences between GA and Ezoic aren’t going to suddenly take a turn like it did.
On Feb. 14th, something really weird happened where Average Session Duration dropped and Bounce Rate spiked in Google Analytics.

But Ezoic’s Big Data Analytics doesn’t show that any drastic changes like Google Analytics does. I can only get one metric on Ezoic at a time, so I’m only showing Bounce Rate here.
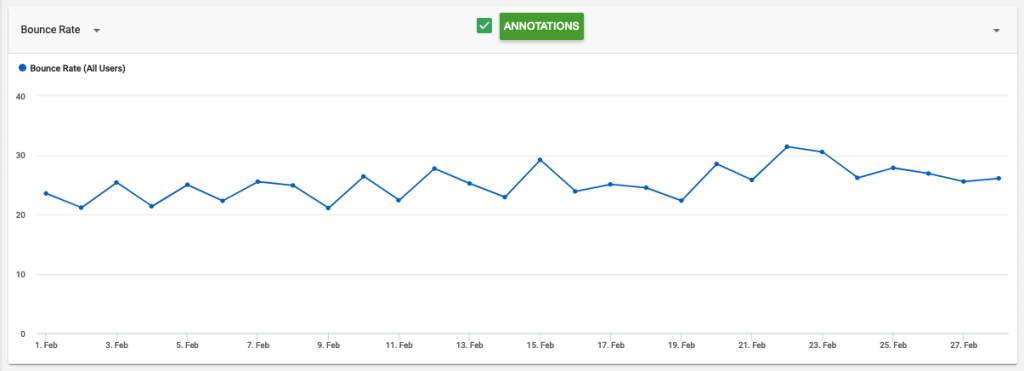
I didn’t do anything around that time that I could think of. I didn’t see anything in my log of changes either. The only other place I could think of changes coming from is Google Analytics itself or Ezoic.
My other sites with essentially the same WordPress and Plugin stack weren’t affected, so I turned to Ezoic. Interesting enough, there was also something that happened with pagespeed that I noticed on Ezoic’s dashboard.

Note that the page speed was also slammed down on Feb. 14th.
I talked to my Publisher Success Manager at Ezoic, because they had done some things earlier in the month with caching. They said they didn’t do anything on Feb. 14th or around it, but they’re still helping to troubleshoot the GA bounce rate and average session duration time.
For page speed, I was able to fix it by deleting deactivated plugins that were just sitting there. Don’t know why that would’ve fixed it, but after I did the deletes, page speed came back up.
I’m not really worried about time on page and bounce rate on GA. But I do want traffic numbers that I can trust.
I may need to switch to using Ezoic’s Bid Data Analytics for future reporting, but we’ll see what the tests turn up.
Site 2 Amazon Affiliate Earnings
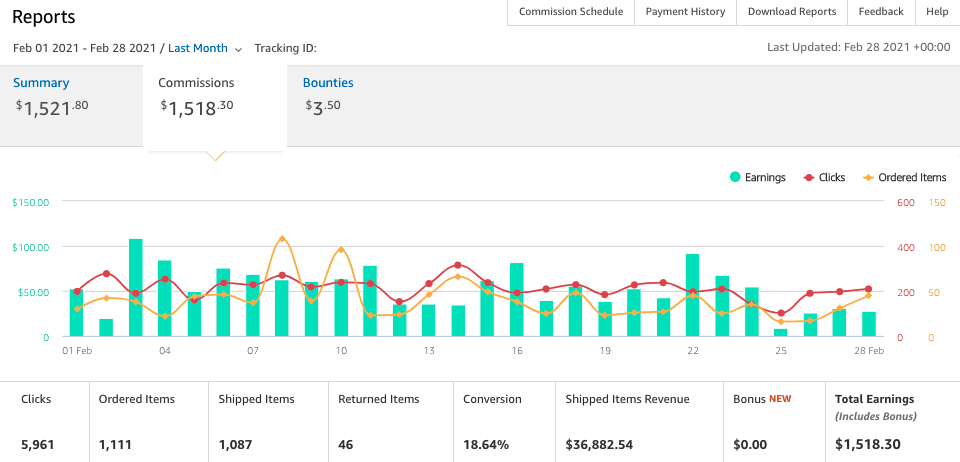
Amazon Affiliate commissions dropped $1,518.30 with the lower traffic and lower revenues per shipped item.
Conversion rate of visitors clicking from the Site to Amazon continued lower. That does make sense as the informational articles I put up in Dec/Jan. are getting more traffic. So, there are no click-throughs to Amazon from those articles. That’ll bring the average down.
Here are the Conversion Rates for the last 5 months. Left (lower) number is the Conversion Rate of Purchases from people who click-thru to Amazon. The Right (higher) number is the Visitors who click-thru to Amazon.
- Oct 2020: 15.67% and 71.47%
- Nov 2020: 17.61% and 73.37%
- Dec 2020: 18.72% and 70.06%
- Jan 2021: 13.80% and 64.78%
- Feb 2021: 18.64% and 61.72%
Site 2 Ezoic Earnings
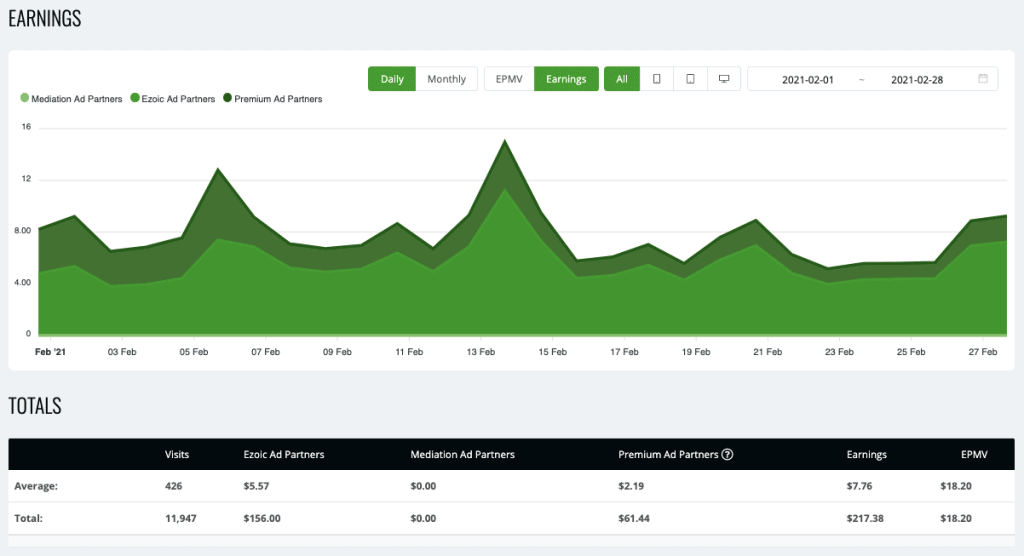
$217.38 in Ezoic Ad earnings with an EPMV of $18.20.
Site 2 Expenses
Spent $130.23 here, mainly with content and Ezoic costs.
Site 2 Plan For March
Want to add more content here. It’s still always been on the back burner, even though it converts well.
Site 3 – Recap And Income Report Breakdown
| SITE 3 | SESSIONS | REVENUE | EXPENSES | P&L | ARPU |
|---|---|---|---|---|---|
| June 2020 | 95 | $0 | $5.00 | ($456.00) | $0 |
| July 2020 | 309 | $0 | $22.00 | ($22.00) | $0 |
| August 2020 | 203 | $12.41 | $5.00 | $7.41 | $0.061 |
| September 2020 | 250 | $8.24 | $31.00 | ($22.76) | $0.033 |
| October 2020 | 355 | $37.31 | $31.00 | $6.31 | $0.105 |
| November 2020 | 498 | $100.72 | $65.00 | $35.72 | $0.202 |
| December 2020 | 655 | $71.82 | $66.00 | $5.82 | $0.110 |
| January 2021 | 686 | $106.54 | $69.16 | $37.38 | $0.155 |
| February 2021 | 512 | $25.00 | $7.55 | $17.45 | $0.049 |
Site 3 had a down month too. This one should be a little less seasonal, but with the expired domain fiasco of this site, it’s taking longer to get steady. Rankings are jumping up and down with a couple articles steady in the Top 10 of SERPs.
Other articles are slowly moving up into Position 20’s-40’s, but not getting traffic yet.
I added my first article to this in months. I’ve updated content here and there, but not much.
I’m planning to add 1-2 articles a month to help with telling Google that this site is alive and still going. I know some people leave their sites for months or even years with no new updates. But I still like to let Google know the site is alive with new posts or updating content at the least. That should tell Google to keep coming back and not to lower the site’s crawl budget.
Site 3 Google Analytics Traffic
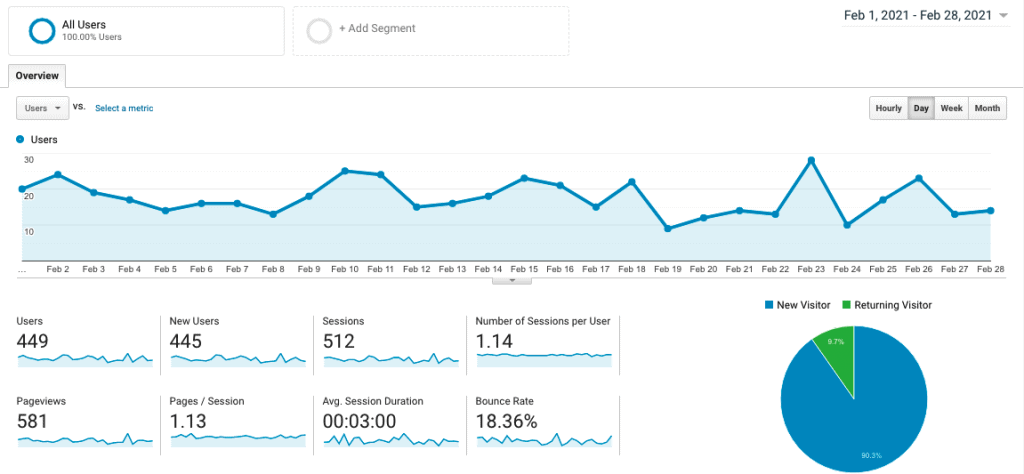
Here’re are the Average Session Durations and Bounce Rates for the last 5 months:
- Oct 2020: 2:34 and 20.00%
- Nov 2020: 2:11 and 21.04%
- Dec 2020: 2:45 and 21.07%
- Jan 2021: 3:02 and 14.87%
- Feb 2021: 3:00 and 18.36%
It’s good to see the session times and bounce rates holding steady.
Site 3 Amazon Affiliate Earnings
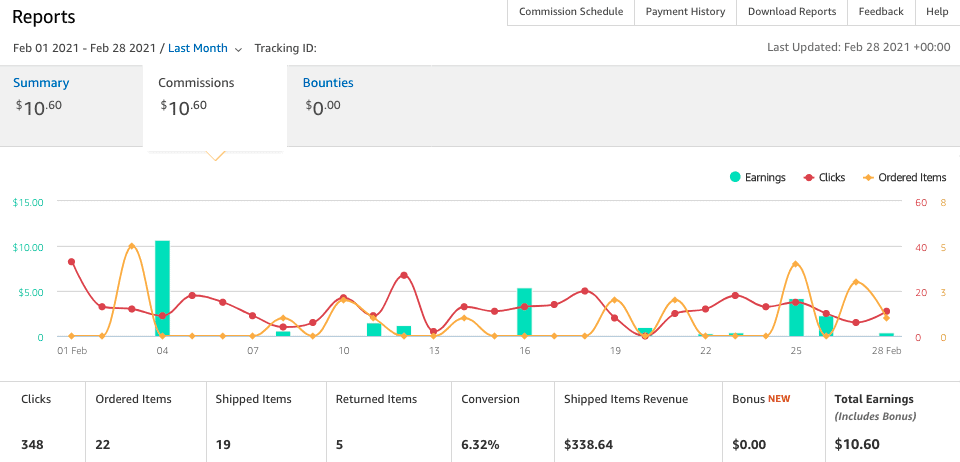
The $10.60 is the lowest Amazon earnings since Sept., which had half the traffic of Feb.
Total earnings should be more than double, but the returned items actually hurt the earnings. Those 5 refunds accounted for more than the $10.60 in Amazon affiliate commissions.
After the first few days of March, the earnings from those items once shipped, should already beat the $10.60 from February!
Site 3 Ezoic Earnings
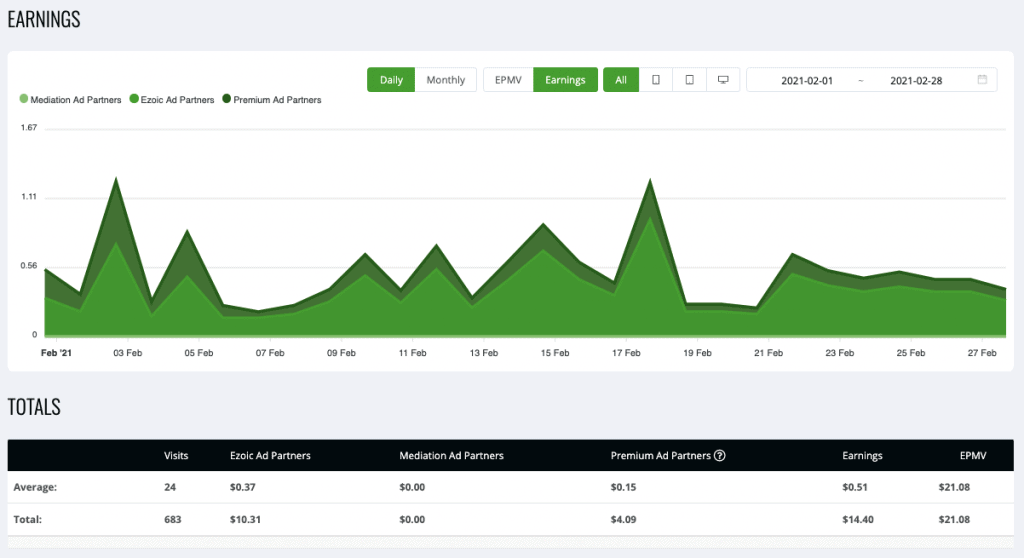
Great to see that EPMV broke the $20 barrier to $21.08.
One of the articles that also moved into Page 1 of SERPs has a good RPM. The other page that’s on Page 1 got more traffic this month and that also helped to increased the EPMV.
Site 3 Expenses
Expenses were just $7.55 as it was just hosting and its share of Ezoic costs.
Little-by-little chipping away to get to breakeven on the site. Overall, Site 3 is in the hole for -$395.68.
Site 3 Plan For March
Will look to add 1-2 articles this month. I have a writer on one article now.
Brand New Site – Site 4
Not too much going on with the site just yet.
Published another 10 articles in February for a total of 17 articles on the site now for a total of 47,319 words.
Here’s the look at the Search Impression numbers from Google Search Console.
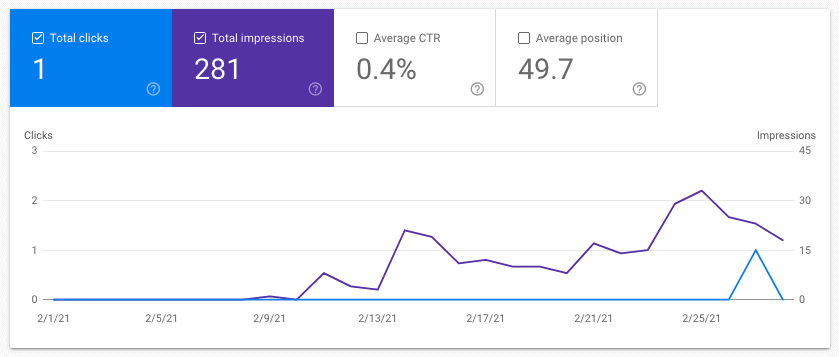
233 of the 281 impressions came from one pillar page that was published on Feb. 9th.
Interesting to see that one article start getting ranked on a brand new site on its first day. Sure didn’t expect that.
When I noticed what was going on a few days later, I went back in and put in AAWP product boxes and all that to optimize for conversions. This brand also has an affiliate program on CJ.com, so I’m going to try testing a non-Amazon affiliate here too.
Here’re the Google Analytics:
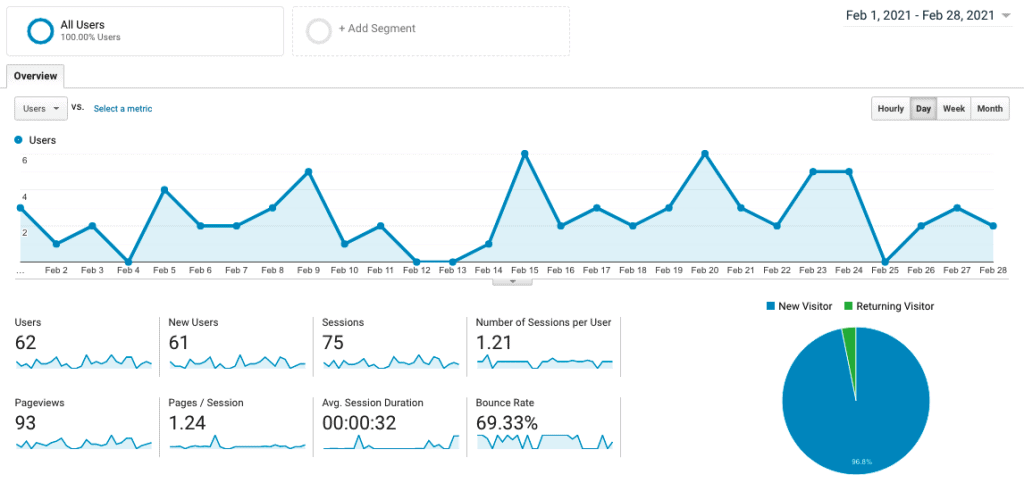
It’s been getting a little traffic from social media. One of the things I always do is to create social media accounts and make posts to start getting the domain out there for Google. It’s not so much to get traffic, as much as it is to tell Google that this is a real, legit site. Not just an affiliate website.
The traffic is nice to see though.
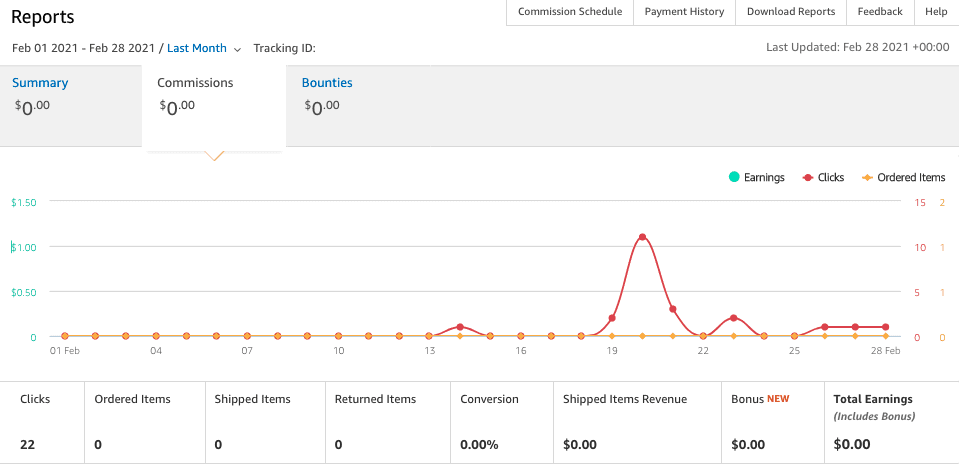
Even nicer are the Amazon clicks. No commissions, but at least people are clicking through. Visitors got click-happy on Feb. 20th!
Final Thoughts
That’s it for now. Overall slow month. I’m expecting more similar months as it definitely looks like the end of the year is peak season.
I’ll continue to look for ways to increase traffic and revenue.
If you’re not getting the the Niche Surfer newsletter each week, go to NicheSurfer.com and sign up for it.
The newsletter contains links and resources focused on helping you on your affiliate marketing journey.

